Transport Map
I recently added a new Transport layer to OpenCycleMap, which some of you will have spotted, and I hope you find interesting. The eagle-eyed among you may even have spotted it as one of the maps on Grant's curious OpenWhateverMap!
I first visualised bus routes in 2008, and ran a few experiments on railways as part of an experiment in terrain maps just over a year ago. In the mean time I've had these ideas on the back burner while I focussed on OpenCycleMap, but recently made some space to put them together into a fully-fledged project. I'm not the first to make a transport map, with öpvnkarte being a famous but no-longer-updated example, but the cartography is something personal that I have my own take on and I enjoy the challenge of creating special-interest maps. So while taking a break from terrain-data processing I put the transport map together. There are certain features of the map that are drawn directly from OpenCycleMap, and there are new developments that I will eventually re-incorporate too.
One of the phrases I started using a few years ago is "render and they will map" - or, in other words, if you are interested in a particular aspect of mapping data being improved then the best way to encourage mappers to improve that is to make it visible and useful. Certainly after I started rendering cycle routes their number in OpenStreetMap increased dramatically, and similarly for the other specialist things in OpenCycleMap. I'm hoping that my world-wide transport layer will encourage similar things in the area of transport data such as adding greater detail to railway stations. In the UK we have patchy levels of detail in bus stops and bus routes; even in London many bus stops have obvious errors in their names. I suspect since they aren't shown on the current mainstream maps nobody is noticing (and hence fixing) the problems, but, over time, the data should mature and the transport map will therefore improve too.
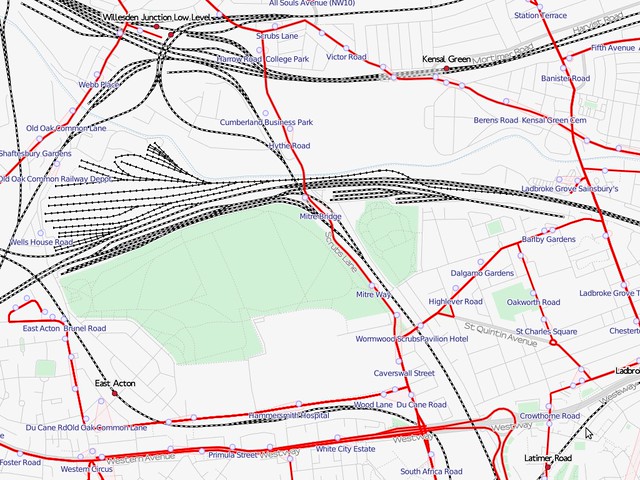
Another aspect of the OSM data is the high level of detail in the data, which can make some mid-range zoom levels incoherent. I've tackled these in two different ways - for example, railway yards and sidings can be distracting when looking at inter-city rail corridors, but the transport map checks for the appropriate tags to hide them where possible. However, the tags aren't widely used at the moment since they aren't rendered on other maps, but in this way my map will improve over time as the mapping volunteers add ever greater details. In contrast, I've used the station buildings to obscure some of the track details at mid-zoom levels, and gone one step further in simplifying the building geometries at the same time - but losing some of the complex detail of OSM can give better cartographic results. I've got further examples and some experiments lined up, and if my talk is accepted I'll be discussing these at State of the Map Europe later in the year.
For now I'm working on speeding up the rendering - this is the first full-blown map I've made with Cascadenik and the performance is surprisingly poor. I'll be trying to nail down what's causing this and share that with you soon. In the meantime I continue to work on the cartography and I'm interested in your feedback and questions.
This post was posted on 11 April 2011 and tagged General