Posts
- Where did the email go? - The biggest hurdle and the one that spread them out was confirming their email. Given that the OSM servers are on the same campus as we were, it took an extraordinary amount of time for them to appear. But the issue here was that on the user signup page there was no indication as to which email address the confirmation email was sent to, and one person was worried there was a typo. It also made it impossible for me to check that there wasn't a typo in their (to them) brand new address.
- Nobody reads the CTs, and everyone ticks the PD box without reading it either - I'll win no friends with this observation, but I saw nobody scrolling the CTs box, and everyone reflexively ticked the box beside the agree button. I'm guessing they all thought it was a "have you read the above legal stuff" which you normally get on such forms.
- Send another confirmation email - There's no way to trigger sending another copy of the confirmation email. Sometimes they go missing, and at least if there was a button the frustration levels would go down.
- Not obvious what the settings page is for - After confirming their email the users end up on the settings page, where almost the first thing it shows you is your email address and a box to put a new email address into. That confused a lot of people. Things like add a friend, set a home location, read some getting started notes etc would be more useful
- Highlight unrecognised tags - I found one guy who had, and it's not clear how, ended up with all his name tags with a capital N. These would be better highlighted while editing that it's an unexpected tag.
- Anxiety over tags missing from autocomplete lists - on two occasions I had people worried that what they were typing (in both cases "office") wasn't in the autocomplete list. I had to explain that there are things on Map Features (and elsewhere on the wiki) that aren't in the list, and that's not a problem.
- Confusion over the preset dropdown (10a and 10b on this image) Three people struggled to make it stay open (i.e. click - hold - move - release). One guy kept selecting different things, and didn't realise it was adding more tags and changing one (amenity) that he'd already set, until I pointed it out. I had to explain the small icon (10a) was a button that changed what was on the dropdown. Most of the icons used in 10a weren't understood (car and bike were good, the football and postbox less so). Many people made the same mistake of adding a POI, adding the correct tags, and then worrying that it said "(no preset)" and tried to find the correct thing in the menu - i.e. misunderstood the purpose of it.
- Couldn't find double-click - Since they were entering POIs they'd already collected, they rapidly found themselves without an appropriate one on the POI panel and searched the wiki. With the tags in hand, they were then stumped on how to add a blank POI. One guy worked out he could change the tags on an existing one, but either instructions ("double click") or a multi-purpose / "blank" POI icon would be better.
- Couldn't add extra tags - three or four times people needed the + icon pointed out to them
- Map Features - long descriptions - most people found themselves on Map Features reading the key, value and short description, but I didn't see anyone realise that they could click the value for more details. This should perhaps go (automatically) onto the end of the short description text as a "More details..." link.
- Confusion with abandoned features - repeatedly people found proposed and/or abandoned features, and similar wiki-works-in-progress. As well as not understanding, they also didn't care, and didn't read the page either - they were just skim-reading to find the tags they needed. I'd lean strongly towards clearing off the 3-year-old abandoned pages, but I realise there are "wiki-historians" who want to keep everything for posterity.
- Search beyond Map Features - most people searched up and down the Map Features page using the browser-based search (Ctrl+F). They were then stuck when they couldn't find the thing they were looking for, and had to be pointed towards the search box to search the rest of the wiki. Again, it wasn't clear that there are plenty of things obscure enough to not be on the main list. Also, "Also known as" and "similar to" and "see also" sections of the tag documentation are worth their weight in gold. A surprising number of pages don't have them.
- I'd recommend EC2 if you want to pre-generate large numbers of tiles (say a continent down to z16), copy them somewhere and then switch off the renderer
- I'd consider EC2 for ultra-large setups where you are running 5 or more tileservers already, but only as additional-load machines
- I wouldn't recommend EC2 if you want to run an on-the-fly tileserver. Which is what most people want to do.
- Voids - SRTM has "no data" gaps in certain places of the world, where the radar reflections went haywire. These happen in marshes (not of interest) and mountains (of great interest!), especially over the Alps. ASTER is void-filled already, so the clever-but-inaccurate void-filling I use wouldn't be necessary
- Resolution - It's great that SRTM covers the whole world, but I'd love to see it at a higher resolution. ASTER's nominal resolution is three times greater than SRTM, so it's very attractive.
- Arctic coverage - SRTM only goes as far north as 60°N, which is a bit of a problem in Scandanavia. Although there's GTOPO30 data for these areas, that's got a horizontal resolution measured in kilometres, so not exactly great for me. ASTER covers those areas too, up to 83°N.
- Steve Coast: “This Mapping Stuff Could Really Take Off”
- Richard Fairhurst: “Why Mashpus suck (and cartography matters)”
- Etienne Cherldu: “OSM and the Art of Bicycle Maintenance”
Quick and dirty usability testing of OSM
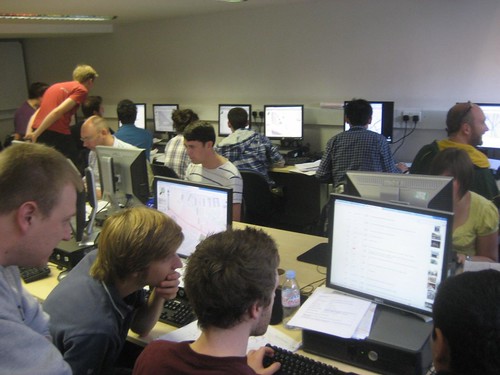
Last week I joined Ant and Deb from MapQuest in order to help out with the UCL mapping party. On the Wednesday I went out with some new Masters students and got soaked in the rain around Camden, but the main interest for me was the following day when we all gathered in the computer lab to uploaded the newly collected data. While I was helping out I was also scribbling furiously whenever I found someone stuck on some aspect of OSM that I hadn't expected.
I was briefly worried that there would be a flurry of activity while they logged on and that I'd miss most of it, but actually the account creation was so long and tortuous that it gave me plenty of time to watch. Silver linings, etc, I guess. I took notes, and so here they are, in the order I wrote them down.
A lot of the most interesting stuff I found was regarding Potlatch 1, and (fortunately?) very little of it applies to Potlatch2 since the UI has been overhauled. I'd love to also work on the Friends functionality of the website, since when the students started "friending" each other, pretty much nothing happened. We could show friends edits, diary entries etc. One thing that stood out for me though, was we should remove the PD tickbox from the CTs. It's added confusion if you read it, and most people don't so the point of it is moot. It's not on the critical path for signup so it shouldn't be in the signup flow at all. It can live in the user settings page or somewhere similar. It's not legally binding and it's not working a straw poll either. Finally, it would be great if there was more stuff possible before the email was confirmed, like adding friends - or even links to introduction videos or something like that.
I'll leave you with the best and least-expected I-never-thought-of-that example of the day. I watched one student find the entry in Map Features for the shop that he wanted to add. He highlighted the icon, right clicked and selected Copy, then changed tabs to Potlatch and right clicked in order to paste the icon where he wanted it to appear.
If only, my friend, if only.
Thanks to Muki Haklay and Thomas Koukoletsos from UCL for inviting us along. If anyone has any similar opportunities for me to come and watch people learning OSM, please get in touch.
This post was posted on 4 October 2010 and tagged OpenStreetMapNew OpenCycleMap tileserver
It's been about a month since I launched with the new OpenCycleMap tileserver. The transition was actually much more hectic than I expected (I'll describe the EC2 failure some other time) but things have stabilised a bit since and are humming along nicely.
So what's new? Almost everything, actually, although mostly things you don't get to see. New hosting, for a start, on a dedicated server with both huge SATA disks (mirrored 1.5Tb) and also a pair of blindingly fast 128Gb striped SSD drives. The postgis database is on the fast disks, everything else being on the SATAs. The speed of the SSD drives really comes into its own while rebuilding the indexes during hourly updates, rather than being directly related to rendering.
I've also upgraded all the software behind the scenes - new versions of mod_tile (with much better monitoring), renderd, mapnik, osm2pgsl. The biggest change that you'll all notice is the tiles are now much smaller - around a third of the size - due to using palletised .png files. The new version of mapnik gives me the raster-handling needed to keep the background colouring at all zoom levels, which is a huge improvement. The biggest change I notice is that we're now using osm2pgsql in slim mode - allowing incremental updates to the database instead of weekly drop/reload - and all of the fancy route-relation handling is now built into osm2pgsql instead of being post-reload SQL queries. It's all much easier to deal with.
The whole upgrade project was delayed somewhat by the initial new server not working out. I'd specced out what I though was an appropriate machine, and everything worked fine - loading the database, testing rendering, the works. Unfortunately the diff updates were, on average, taking around "equal time" - an hour and a bit for an hours-worth of OSM changes, about 20 hours for a days worth of changes - and this with the machine doing nothing else! Disaster. So I scrambled to find a new provider with better hardware (at a reasonable price) and started again with the setup. Hat tip to Hetzner.de for their server offerings, and of course my ex-employers CloudMade for their continued sponsorship of the hardware.
Finally, I managed to sneak in some cartography changes while I was waiting for various things to complete (importing contours for the whole planet takes a few days!). Most of them were fairly subtle, and a fair few have gone unnoticed. Buildings are my new favourite, along with finally making new shield icons to replace the (ugh) nasty old ones (there's a story behind them, as with most things). Can you spot any of the dozen other changes?
What's next? I'd like to say more cartography updates, since there's lots more I'd like to change. But cartography always seems to take a backseat to server administration, and that's, as usual, starting to cause headaches. The huge numbers of people using the opencyclemap tileserver means that there's many millions of tiles to render, and the server is only - just about - keeping up with refreshing them as the underlying data changes. Something needs to be rethought about this, and I'm hoping to find some speed improvements from somewhere to render the tiles faster and let the server keep its head above water. The server troubles are massively exacerbated by thoughtless people out there (abetted by thoughtless software developers) who are bulk-downloading, or scraping, the tileserver for tens of thousands of tiles at a time - approximately none of which they ever view. Plans are afoot to deal with them though!
This post was posted on 8 September 2010 and tagged GeneralMap rendering on EC2
Over the last two years I've been running the OpenCycleMap tileserver on Amazon's EC2 service. Plenty of other people do the same, and I get asked about it a lot when I'm doing consulting for other companies. I thought it would be good to take some time to say a bit about my experiences, and maybe this will be useful to you at some point.
 EC2 is great if you have a need for lots and lots of computing power, and your need for using CPUs fluctuates. At its best, you have a task that needs hundreds of CPUs, but only for a few hours. So you can spin up as many instances as you like, do your task, and switch them back off again. Map rendering, and here I'm talking about mapnik/mod_tile rendering of OpenStreetMap data, initially seems to hit that use-case - generating map tiles involves lots of processing of the map data, and then you have your finished map images which are trivial to serve.
But that's not really the case, it turns out. After you've finished experimenting with small areas and start moving to a global map, you find that disk IO is by far the most important thing. There are two stages to the data processing - import and rendering. During import you take a 10Gb openstreetmap planet file and feed it into PostGIS with osm2pgsql. You want to use osm2pgsql --slim (to allow diff updates), but that involves huge amounts of writing and reading from disk for the intermediate tables. It can take literally weeks to import. When you're rendering, renderd lifts the data from the database, renders it, writing the tiles back to disk, and then mod_tile reads the disk store to send the tiles to the client. All in all, lots of disk activity. And hugely more if you mention contours or hillshading.
Which wouldn't be too bad, except the disks on EC2 suck. It's not a criticism, since it's an Elastic Compute Cloud, not an Elastic Awesome-Disks Cloud. It's a system designed for doing calculations, not handling reading and writing huge datasets to and from disk. So their virtual disks are much slower than you would like or expect from the rest of the specs. On the opencyclemap "large" EC2 instance, roughly one core is being used for processing, and the rest is all blocked on IO. Although it's marked as having "high" IO performance on their instance types page, I'd suggest for "moderate" and "high" you should read "dreadful" and "merely poor" respectively.
Amazon's S3 is their storage component of their Web Services suite. So instead of thrashing the disks on EC2, how about storing tiles on S3? It's possible, but the main drawback is that it makes it much, much harder to generate tiles on-the-fly. If you point your web app at an S3 bucket there's no way that I know of to pass 404s onto an EC2 instance to fulfil. If you're happy with added latency, then you could still run a server that queries S3 before deciding to render, and copy the output to S3, but I can't imagine that being faster than using EC2's local storage. You can certainly use S3 to store limited tilesets, such as limited geographical areas or a limited number of zooms. But pre-generating a full planet's worth of z18 tiles would take up terabytes of space, and only a vanishingly small number of tiles would ever be served.
Finally, there is the cost of running a tileserver. Although Amazon are quite cheap if you want a hundred servers for a few hours, the costs start mounting if you have only one server running 24 hours a day - which is what you need from a tileserver or any other kind of webserver. $0.34 per hour seems reasonable until you price for the first four weeks uptime, where all kinds of non-cloud providers come into play, simply paying monthly rent on a server instead. Factoring in bandwidth costs for a moderately well-used tileserver can make it mightily expensive. Any extras can be added too - EBS if you want your database to survive the instance being pulled, or S3 storage.
EC2 is, more or less, exactly not what you want from a tileserver. Expensive to run, slow disks. So why is it popular? First off is buzzwords - cloud, scalable and so on. If you aren't careful you can easily empty the piggybank on running a handful of tileservers long before you're running enough to do proper demand-based scaling changing from hour to hour during the day. If you're trying to "enterprise" your system you'll worry about failovers long before you need such elastic scaling, and you need your failovers and load balancers running 24x7 too. Second is for capacity planning - if you want to do no planning whatsoever, then EC2 is great! But it's much cheaper to rent a few servers for the first couple of months, and add more to your pool when (if?) your tileserver gets popular. But a there is a third reason that is quite cool - for people like Development Seed's TileMill - you can give your tileserver image to someone else extremely easily, and it's their credit card that gets billed, and they can turn on and off as many servers as they like without hassling you.
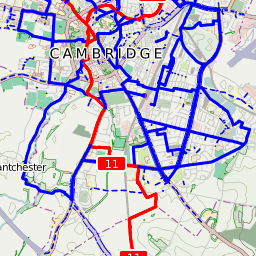 I've been setting up a new tileserver for OpenCycleMap that's not on EC2, and I'll post here again later with details of how I got on. I'm also working on another couple of map styles - with terrain data, of course, and if you're interested in hearing more then get in touch.
So in summary
Any thoughts? Running a tileserver on EC2 and disagree? Let me know below.
This post was posted on 5 July 2010 and tagged OpenStreetMapFinishing the UK road network
A few weeks ago I was discussing the progress of mapping the UK at one of the London OSM pub meetups (Harry picked up on it in his diary entry for the evening). I was making the point that we're making great progress, and if things continue as they are then most towns and villages will be mapped in 12 months time. Now we've certainly heard that before (Steve Coast was targetting summer 2008 if I recall) but my guesstimates are based on weekly road length analysis that I've seen and I'm currently working on making public.
But leaving things to take their due course is the easy way out, and I think we can do most of the remaining work this summer if we collectively put our minds to it. What would that involve? Well, a few dozen mapping parties would be a good start, since there are only currently two scheduled (Witham and Maidstone). CloudMade had been sponsoring a few mapping parties in the past, but that seems to have fizzled out, so it's up to the community to sort things out ourselves. A good source of ideas for places is the UK Mapping Priorities and Secondary Priorities pages. I've been updating the former over the last week, and it's impressive how many places have been mapped over the last six months. But there are some glaring problem areas - anyone want to organise a Darlington party?
What else beyond parties? Publicity is something we've been reasonably poor at over the years. Getting in the press is a good way to "prime the pump" for gaining new members, and probably encouraging people who might have looked before to look again. We can just make random "press releases" about all kinds of things we do - that's what everyone else does! I've just gone looking on the wiki for previous press releases, and they are woefully lacking. Whilst it's great to get coverage in the national press, I think we should be aiming for all the local papers that struggle to find anything interesting to print. Of course, if we had those two dozen mapping parties they would be a good excuse for releases. But beyond that, lots and lots of blogging, discussing on forums and things like that. Just try to find ways to put the word out. I'm selling promotional stickers in the OpenCycleMap shop - any more ideas like that? We could get some funding or fundraising for more leaflets to hand out, or for organising stalls at trade shows, or for buying another banner, or buying our own aerial imagery.
And when we have all these new people, we'll have more awesome tools for them. Grant is sorting out the wiki onto new, faster hardware, and I've been finding time to work on Potlatch2. More development helps, so if you're that way inclined I'd love to have you helping. But it's completely plausible to finish the UK road network this summer if we get organised and get motivated. Who's up for the challenge?
This post was posted on 17 February 2010 and tagged OpenStreetMapASTER - Not worth it yet
A few months ago NASA caused a stir by releasing a new global height dataset called ASTER. I use an earlier dataset (SRTM) for OpenCycleMap, which has a few problems that ASTER, at least initially, promised to solve. The three of primary interest to me are:
So far so good. But when I started work with ASTER in December, things spiralled rapidly downhill. First is the pointlessly irritating "order a dataset" website, that sucked up hours of going round in circles. It's like a shopping website from 1999. You need to use a stupid interface to order which 1°x1° tiles you want, and "All" isn't an option, despite there being 22,600 of them. It seems geared up for people who want a couple of dozen at a time, and the whole thing has a feel of being run by men with beards and sandals who'd rather you didn't use their website in anything newer than Netscape 4 on HP-UX.
When I read the README alarm bells started ringing. There's a section on "mole runs" and "pit artefacts" that sounded a bit worrying, but I wasn't sure how much of an issue they'd be - if they were small and few and far between then that's not much of a problem. But the biggest thing that caught my eye, buried on page six after pages of confirmation of how good the accuracy was, right at the end of a section as a throwaway comment, was the following statement:
Also, while the elevation postings in the ASTER GDEM are at 1 arc-second, or approximately 30 m, the detail of topographic expression resolvable in the ASTER GDEM appears to be between 100 m and 120 m.
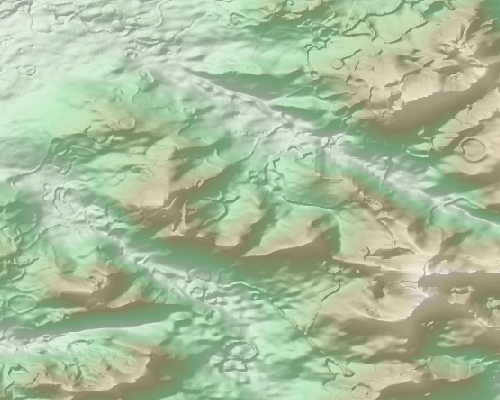
That's a bit of a bomb-shell - it's saying that although it's got a much higher nominal resolution than SRTM, it's effective resolution is about the same - there's not any more actual detail, just more pixels. That was almost enough to make me give up there and then, but it's still void filled and covering more area of the planet, which would be good improvements. So I grabbed the DEM (thankfully, they're straightforward GeoTIFFs) and got to work over Snowdon. I did some colouring and contours, and they both looked excellent and much better than what I made from SRTM. But then I tried hill-shading, and disaster!
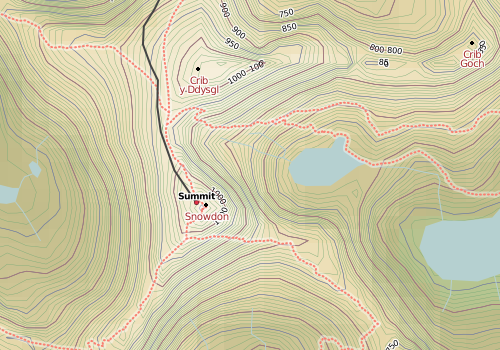
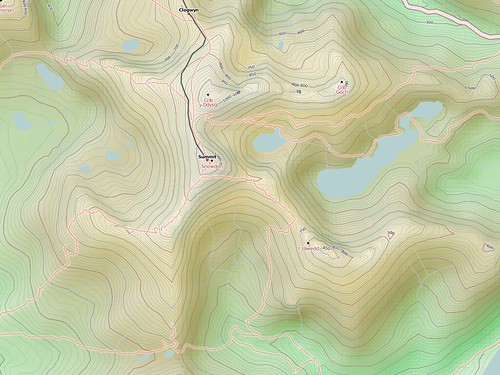
Here's the area around Snowdon (click through for original size):
and a detail of Snowdon itself:
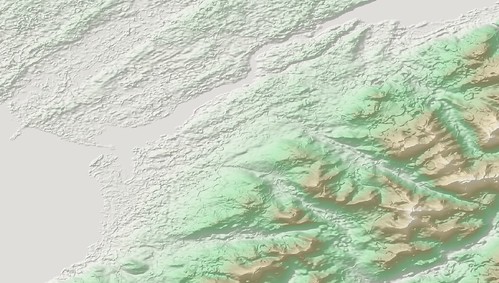
The mole runs are everywhere - all across that image, even on the flat bits. And the pit artefacts are huge - the size of quarries, and really, really obvious. I honestly can't use that - maybe for a "what the world would look like if it looked like the moon" project, but nothing more serious than that. And considering that SRTM has only a handful of single-pixel voids in that area, the guys making ASTER have made something that's substantially worse than an oversampled SRTM. And considering they were even using SRTM to fill the gaps in the ASTER data, that's a pretty poor show. I started reading around and found a few people saying similar things. And when I though about it, the "improvements" to the contours I saw could be recreated with SRTM by using gdalwarp to artificially increase the resolution (with some nice smoothing) before generating the contour lines. So I gain nothing from ASTER in the 95% of the planet that doesn't have significant voids, and in that same 95% it's not really usuable.
So for now, I've given up with ASTER. I might revisit it for the band between 60°N and 83°N, but it also says in the readme they have voids over eurasia for that area (so much for void-filled, eh?). And it would be interesting to see if someone can fill the large SRTM voids with ASTER (which sounds back to front, hey-ho), but I don't have time for that. However, as they say in the docs, all these artefacts are happening in the boundaries where they have different numbers of original samples, so maybe a future version will have these automatically smoothed out, and it they can figure out how to stop their 15m sampling getting turned into 120m effective resolution, that would be awesome. But for now I would say it's not worth using it.
This post was posted on 13 January 2010 and tagged GeneralHill-shading on OpenCycleMap.org
It was over 18 months ago that I was originally trying to get hill-shading and hill-colouring working on OpenCycleMap (in fact, it wasn’t even called that back then, but that’s a different story). I eventually dropped the hill-shading part of it due to nasty boundary artefacts between source tiles, and due to the fact that the shading, well, didn’t look as nice as I wanted. It was all a bit grey and manky.
So instead I launched just the hill-colouring in August 2008, which I was very happy with, and put hill-shading on the back burner. Time passed. Much time.
A few weeks ago, I rolled up my sleeves and got stuck in to figuring out how to do the hillshading properly. With some pointers from Matt, Mike and the OSM Wiki, I played around for a few days until I liked the end result.
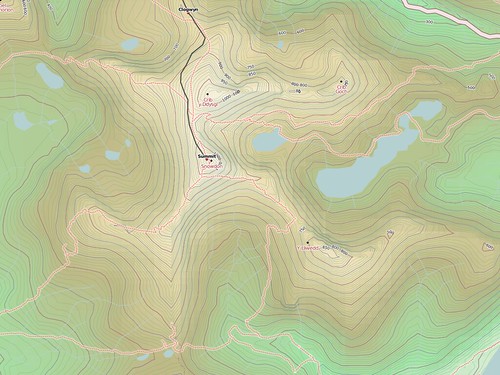
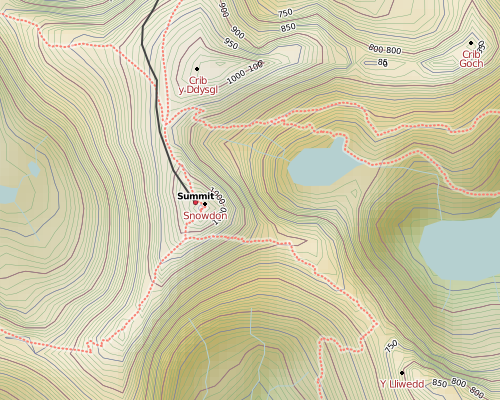
Here’s a look at Snowdon before hill-shading. The colours do a good job of showing the lie of the land, but it’s a bit flat:
Detail:
And what Snowdon looks like now. The shading lifts the peaks out from the map, and gives them a more solid-object feel:
Detail:
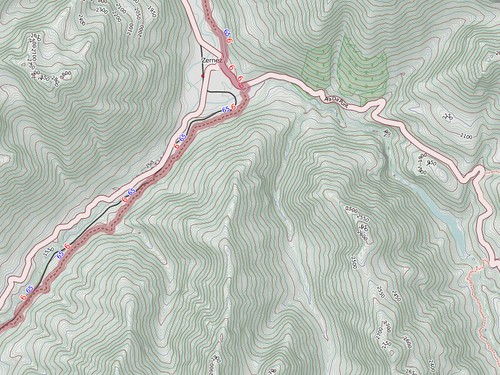
It really helps most in complex mountains, like here in the Alps, where the contours would otherwise become a jumble and it’s hard to tell valleys from ridges. With the shading, it’s easy.
It’s a hard balancing act, since OpenCycleMap is first and foremost a map for cyclists, and too much hill-shading overpowers and distracts from the rest of the map. But then again, too little and it doesn’t seem worth the effort! I went for a subtle approach, where it’s enough to make the hills stand out but little enough you might not consciously notice. Unfortunately the effect is diminished in forested areas, and by dense contours, since it’s only the background height colouring that is shaded and those things start obscuring stuff.
Also, I was never really happy with the “drab grey” approach to shading - just making the shadows grey and the highlights white using alpha-blending - so I settled in the end for “hardlight” compositing. It’s a bit like the evolution of GUI buttons from Windows 3.11 (“right, top and left edges are white, other two edges are black, grey in the middle”) with those from MacOSX (“ooh, shiny”). Compare OpenCycleMap to Google Terrain and other hill-shaded maps, and I’m quite proud of the results.
If you have a map project that could do with some good-looking terrain info, then I’m available for freelance work.
This post was posted on 5 January 2010 and tagged OpenStreetMapThe View from Above
Over the last few months I've been involved in three different aerial imagery projects, all of which were to make imagery available for OpenStreetMap contributors. It's nice that we have imagery available from the guys at Yahoo!, but on occasion we lay our hands on some better stuff.
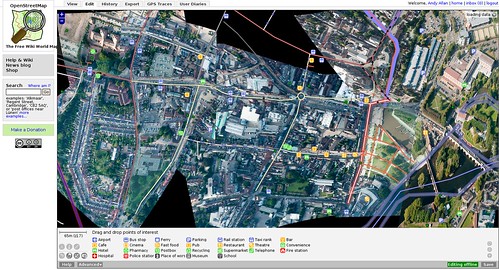
First off was Stratford-upon-Avon, here in the UK. As an experiment we hired a small plane, put one of our contributors on board with his SLR, and flew around town. All the photos were then put on line, and even though I'd never been to the place before I could use Tim Water's online map rectifier and re-purpose it slightly to warp the photos and line them up to the map data. Other people did the same, and then I collected all the separate images and processed them into one map layer. A few days later I was at a "Traditional GIS" conference in Stratford, and there was a great deal of interest from people in the aerial imagery project and OSM in general. I can recommend it as a publicity stunt for other conferences!
You can see more pictures of the end results on flickr, or read more about it on the OpenStreetMap wiki.
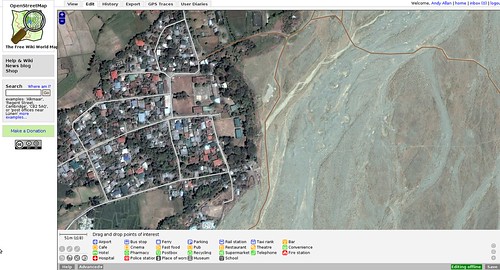
Next up was the Philippines. After massive deadly flooding aid agencies on the ground were using OpenStreetMap to help with the disaster relief. Manning Sambale from the OSM Philippines community received a donation of satellite imagery of part of the affected area, and asked for help processing it and making it available. I made some space available for him to upload it, and then processed it into the right format for OSM editors. With such high-quality imagery available so soon after the disaster, OSM volunteers both in-country and working remotely set about mapping the villages and marking on the locations of bridges and damaged areas. You can get a sense of scale of the damage from the image below - the gravel banks covered fields and villages around the river, and the imagery was a huge help.
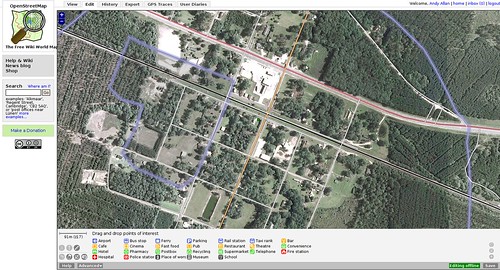
The third project was in Georgia, USA, where I got hold of some fairly recent (2007) imagery from the Department of Agriculture National Aerial Imagery Program (NAIP). Although Yahoo! has good quality imagery available across the whole of the USA, this public-domain imagery was more up to date and slightly higher quality that what Yahoo! has in rural areas of Georgia. This is by far the biggest set of imagery I've had access to - hundreds of gigabytes of the stuff - and only a handful of counties were processed.
I'm sure as time goes on we'll get more and more sources of imagery to help with OSM, and I look forward to lots of "crowd sourcing" experiments like the stuff from Stratford as much as I like the imagery from the professionals.
If you have access to any sources of imagery and need a hand getting it processed, get in touch!
This post was posted on 9 December 2009 and tagged OpenStreetMapState of the Map 2007 Videos - in HD!
When Jon Burgess found out that I was editing the 2008 videos, he dug out his recordings of the first SOTM conference and sent me a disk full of them. This time I knew what I was doing a bit more, and the quality is much improved - in fact, if you have the bandwidth and computer for it, you can also watch them in full HD glory.
Unfortunately Jon didn’t have enough space to record all the talks, but we have 15 available on vimeo. For a full list of talks and links see the OpenStreetMap wiki, or just have a look at my video account and watch them all!
My pick of the bunch are:
It’s great watching these videos - I wasn’t even “into” OSM enough back then to go the conference! And it’s nice to see the things that are wildly different now, and all the things that are still familiar topics.
This post was posted on 27 November 2009 and tagged OpenStreetMapThe Pottery Club
 Imagine, if you will, a small town with a surprisingly active pottery club. Every week they gather in the local arts centre, and spend long evenings making pottery together. They take lumps of clay and sculpt them into vases, mugs, bowls, teapots and all kinds of things. They share tips and tricks, and help each other out - some people just do their own thing, but there's a real sense of community. It's not surprising to find them taking a break together in the local pub, where they spend a lot of time talking about their hobby. The pottery they produce is really high-quality stuff too - a labour purely of love and fascination, not driven by cost/benefit ratios, deadlines or schedules.
Now these people are so interested in their pottery hobby that they happily make far more of it than they need, and so they give away much of the end results - after all, it's a hobby and they have already got all the teapots they need (and maybe they have a bottomless pit of clay nearby or something that makes this analogy more plausible). And other people appreciate all the free pottery, and wonder what they can do to help. These outsiders come with fairly pure intent - they want everyone in the whole world to benefit from these high quality teapots and vases.
And so the outsiders think about how they can improve this pottery club. They come up with the idea of helping by shipping in partly-made vases and teapots, and letting the club just "finish them off". After all, it'll save time and be easier for everyone involved, and gets everyone towards having those next 10,000 vases that much quicker than just waiting for the club to do so in their own time and expand at their own rate. So truckloads of distorted, broken, low-quality, half-finished wet pottery starts arriving at the back door to the club. Some people start taking this pottery and trying to fix it, and a few people in the club think that it's a great idea. But a lot of people start getting disillusioned. They realise that fixing other people's mess just isn't as fun as starting from scratch and making a proper job of it themselves. The banter in the club stops, and it turns into a factory line - no sooner are they finished fixing up one batch of bodged-up pottery than another arrives. More outsiders are scouting around for sources of low quality pottery - after all, if you give it to this Club then they will fix it. But the output quality starts falling as "good enough" pottery is given away, where before they would have bandied together to keep their high standards. People start enjoying the whole thing less, they start drifting away, and the club slowly falls apart. Takings also fall at the pub.
Enough of the story telling. This article is in the "OpenStreetMap" category because I want people to think of this parable when they are considering bulk imports. The strength of OSM is the community. The creation of this dedicated community is a high-quality map. There are ways to help the community, and there is usefulness in using other data sources to assist. But if we continue down the path of treating the community as a mechanism to "fix-up" broken or low-quality data imports, whether that be TIGER, GNIS, NaPTAN or any of the others, then we'll ruin ourselves in doing so.
This post was posted on 10 November 2009 and tagged OpenStreetMapState of the Map 2008 videos online (at last!)
I'm sure we've all got videos that we mean to edit, or photos we mean to upload, but we never really get round to it. OpenStreetMap has been in a similar position for the last few years regarding videos of its annual conference - the "State of the Map" - which have languished in dark corners. Earlier on in the year I set about tracking down the footage from SOTM08 in Limerick, to see if I could help out. We got hold of the raw footage, and I slowly worked my way through figuring out which clip was which, editing out the inevitable inter-speech faffing, fiddling with the sound and lighting levels and encoding the whole thing. As if that wasn't enough, uploading them has taken the best part of the last 10 weeks, but it's all done! Every speech from the main room is now available online, for everyone who was there and wants to reminisce, for those who couldn't make it to Ireland, and for the 78% of OSMers who have joined up since!
You can find a list of all the talks and links to the videos on the OpenStreetMap wiki: State of the Map 2008
There's some classic OpenStreetMap history in their, from everything Hiroshi says (sadly with some audio problems in one clip) to Gervase's now infamous OSM Fieldwork project. Got any favourites yourself? That's what the comments are for, below.
The observant amongst you will have noticed I haven't mentioned SOTM07 in Manchester yet, although I've been tarting up the wiki page in anticipation of... something... Unfortunately not all of the first conference was actually filmed, but the corollary is suggestive... If you want to help out with my costs for this effort, or simply to show your appreciation, here's a donations link. If you don't want to donate, a "thank you" in the comments is a perfect alternative!
![]()
subscribe via RSS
